Email Data Science Tutorial: Setting Up & Using The Shorenstein Notebooks
Most email analytics are, to put it mildly, not very good.
The guidance given to us by numbers like open rate or click-through rate often encourage a kind of passivity: too many of us watch our numbers like they are the weather – just something that happens to us. Or, if we are acting in response to our analytics, we are going on very slender evidence that we know why a particular day’s numbers were good or bad.
In 2017, along with a team at WBUR, I launched The Magic Pill, an audio newsletter that won the Edward R. Murrow Award for Excellence in Innovation. We chose email over other delivery platforms because we knew that email would give us much more data about who our listeners were and what they liked than iTunes did. Still, at the time, I would have loved to have known more about subscriber behavior than I was getting at the time from Mailchimp.
That’s why I was excited to read The Shorenstein Center’s paper Using Data Science Tools for Email Audience Analysis: A Research Guide, by Jacque Boltik and Nicco Mele. I was even more excited to see that they had provided a set of tools so that we could do the analysis they talked about in their paper with our own data.
On Thursday, March 8, I gave a presentation to Seattle’s ONA Local chapter on applying data science tools to build better email products. We didn’t have the time to do a hands-on runthrough of this particular tool, so this tutorial is both for attendees of that event who want to go further, and for those unable to attend but are interested in the intersection of data science and email. My full presentation, and linked resources, can be found here: Lisa Williams: Data Science & Email.
This post is intended to be a guide to setting up and using those tools. It is especially aimed at the technologically curious person who works on an email product, but has little experience with data science tools or coding. Beginners welcome here!
Tools We Will Use
This guide is written from my POV as a Mac user, but many of the basic tools will work on Windows, and of course on Linux. I regret that I can’t give line-by-line instructions for those platforms, however.
Terminal We will be using the command line for this tutorial.
Git and Github The files we use to do our data science experiments are located on Github.com, a code sharing and collaboration site, and we will use the version control system, Git, to get them down onto your computer.
Anaconda The Shorenstein Notebooks use Python, so we will download a distribution of Python.
Jupyter Notebooks These can read the Shorenstein notebook files. It comes with Anaconda.
You will also need a modern web browser. I am using Chrome Version 65.0.3325.146 as I carry out the steps of this tutorial.
Getting Started
Download and Install Anaconda
If you don’t know if you have Anaconda installed, open up Terminal. You will find Terminal in the utilities folder. Type conda --version. If Anaconda is installed, it will give you a response like conda 4.3.30. Check on the Anaconda website to see if you have the latest version. If you get no response, you’ll need to download Anaconda and install it.
Get a free Github account
If you do not have one already, you will need a free Github.com account. Github is an online code-storage and collaboration service.
Download and install Git
Git is a ‘version control system.’ Often, when I am coding, I try something, and I break things. Having a version control system means I can ‘roll back’ my code to a previous state…one where it was working. Git and Github work together. Git is the part that resides locally on your laptop; Github is the online service where you store an extra copy of your code or collaborate on code with others.
First, check to see if you already have Git installed. Back in Terminal, at the command line, type git --version. If it is installed, you’ll get a response like this: git version 2.11.0 (Apple Git-81). If you don’t have it, it will prompt you to install it.
Fork and Clone the Shorenstein Notebooks and Sample Data files
If you’ve never heard the phrase ‘fork and clone’ before, don’t be worried. It just means you’re going to make your own copy of the notebooks on your Github account, and then ‘clone’ those files down onto your local computer using Git.
Visit the email-data-science-tutorial repository I set up on Github. This repository contains Jupyter Notebook files created by the team at the Shorenstein Center, as well as sample data files of email list subscriber data. In the upper right hand corner, you will see the Fork button:
Click the Fork button. You’ll notice a cute animation, and then you will be taken to your own copy of the repository. You’ll know if it worked if the URL for the page is http://github.com/yourusername/email-data-science/
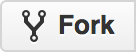
Once you arrive there, you will see another button that reads ‘Clone or download.’ Click that, and then copy the URL you see in the window that pops up:
Unzip the Sample Data File
At the command line, type ls. You should now see a folder titled email-data-science-tutorial. To change into that directory, type cd email-data-science-tutorial at the command line and hit return. Once you are in the folder, type ls again. You will see the notebook files and the sample data files. One of the sample data files is quite large, and you will need to unzip it before continuing. The file is called nb2_anon.pkl.zip. At the command line, type unzip nb2_anon.pkl.zip and hit return. If it works, you will get a response like this:
Archive:  nb2_anon.pkl.zip
  inflating: nb2_anon.pkl
   creating: __MACOSX/
  inflating: __MACOSX/._nb2_anon.pkl
Type ls again at the command line, and you’ll notice you have a file called nb2_anon.pkl.
Run Jupyter Notebooks
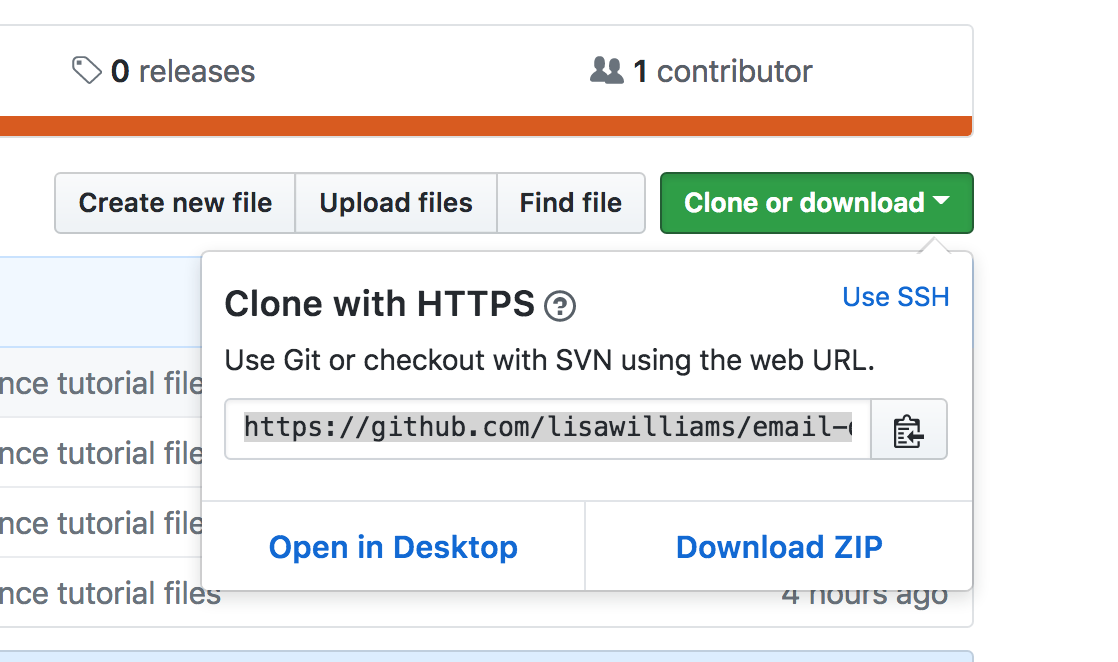
It’s time for the magic! Type jupyter notebook at the command line. Your browser should open a new tab, and if all goes well, you should see something like this:
Click on the first Notebook file. You’ll get a new tab that looks like this:
Scroll and Explore
Scroll down to explore how the notebooks slice and dice the data. Be sure to open both notebooks – they show very different views of the same subscriber data! For a full explanation of what you’re seeing, read the accompanying paper from Shorenstein for a full explanation.
Shut down your notebook kernels before leaving
At your notebook home screen – the one with the list of files – you’ll see a tab called ‘Running’. Click this. Shut down any running kernels or they will run in the background and take up your CPU.
Then, visit the command line and shut down the Jupyter Notebook application by typing Ctrl-C.
Special Thanks
Special thanks to Jacque Boltik of the Shorenstein Center and devens.io, who provided invaluable help in creating sample data files and hooking them up to the notebooks for this tutorial. Special thanks are also due to Sarah Darby, Anika Anand, and Michelle Baruchman for making the email data science workshop in Seattle happen, as well as Meghan Murphy of ONA and the ONA Speakers’ Bureau.
Additional Resources
Lisa’s email and data science presentation
A Guide to Jupyter Notebooks for Beginners